load(file='metadag_work_space.RData')6 Appendix
Some tables and graphs for the supplementary material.
Table MBB sizes
write_delim=write_delim(table_MBB_size,
                        file="data_appendix/table_MBB_size.csv",
delim=",")clust4_MSA2=tibble(mDAG_Id=names(clust4_MSA),
clust4_MSA=as.integer(clust4_MSA))
clust4_Mun2=tibble(mDAG_Id=names(clust4_Mun),
clust4_Mun=as.integer(clust4_Mun))
clust4_MSA_Eukaryotes_taxo= meta_taxo %>% filter(!is.na(Kingdom))%>%
select(-c(Freq_Kingdom,Freq_Phylum,Freq_Class)) %>%
left_join(clust4_MSA2,by="mDAG_Id")
clust4_Mun_Eukaryotes_taxo= meta_taxo %>% filter(!is.na(Kingdom))%>%
select(-c(Freq_Kingdom,Freq_Phylum,Freq_Class)) %>%
left_join(clust4_Mun2,by="mDAG_Id")
write_delim(clust4_MSA_Eukaryotes_taxo,
file="data_appendix/clust4_MSA_Eukaryotes_taxo.csv",
delim=",")
write_delim(clust4_Mun_Eukaryotes_taxo,
file="data_appendix/clust4_Mun_Eukaryotes_taxo.csv",
delim=",")Heatmaps by Kingdom MSA y Mun: Animals, Fungi, Plants ans Protists.
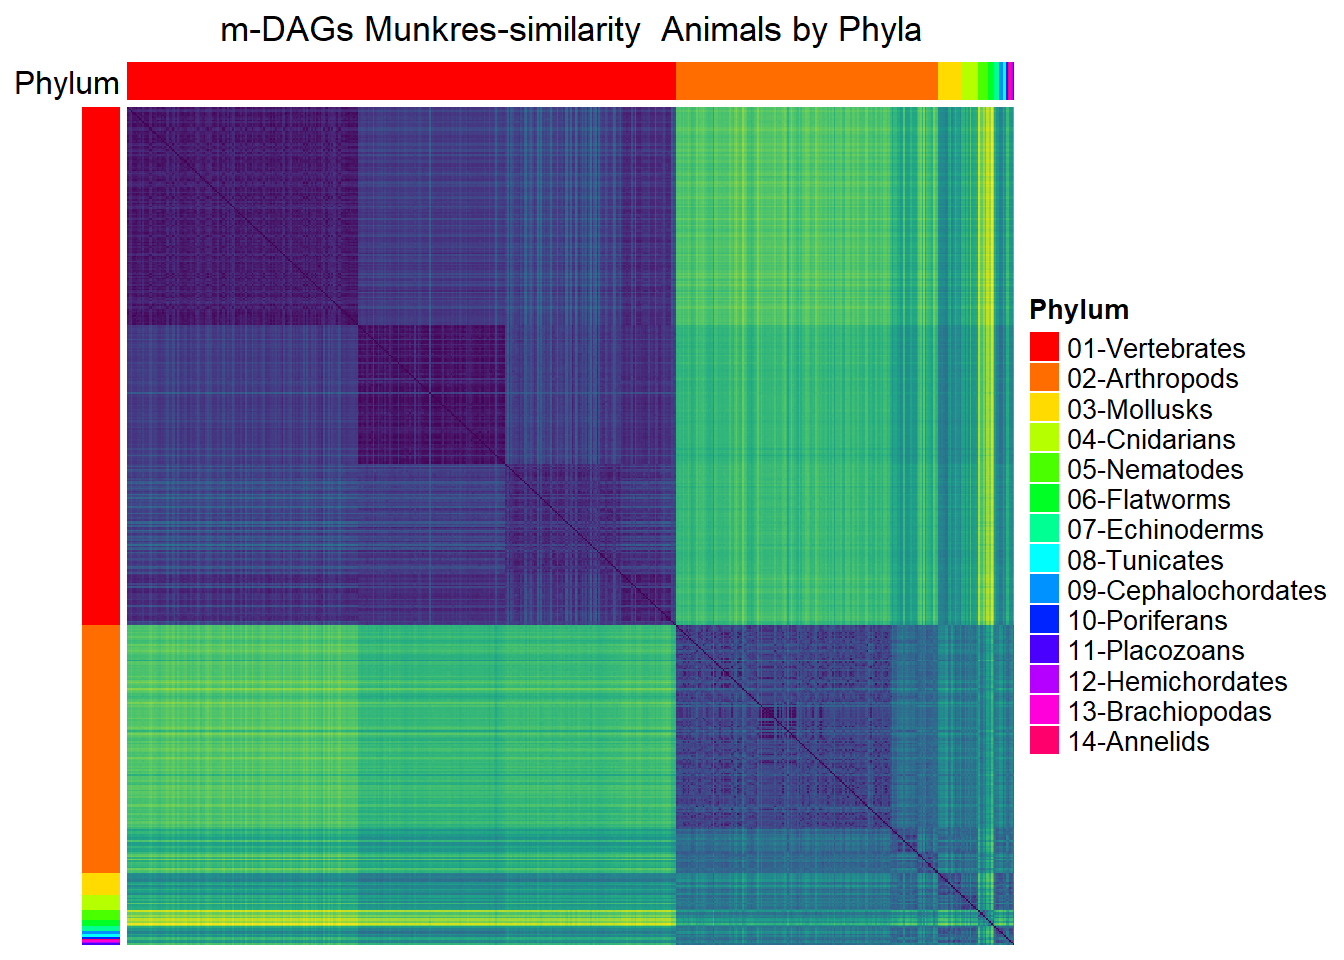
Animals
##  Animals by phylum
meta_animals= meta_taxo %>% filter(Kingdom=="Animals")
namesP=names(rev(sort(table(meta_animals$Phylum))))
namesP
[1] "Vertebrates" "Arthropods" "Mollusks" "Cnidarians"
[5] "Nematodes" "Flatworms" "Echinoderms" "Tunicates"
[9] "Cephalochordates" "Poriferans" "Placozoans" "Hemichordates"
[13] "Brachiopodas" "Annelids" dff=data.frame(Phylum=meta_animals$Phylum)
Phylum=ordered(meta_animals$Phylum,levels=namesP)
numbersP=paste(c(paste0(0,1:9),10:14),namesP,sep="-")
levels(Phylum)=numbersP
dff$Phylum=Phylum
col=rainbow(length(namesP))
colorsP=list(Phylum=col)
names(colorsP$Phylum)=numbersP
annot <- HeatmapAnnotation(df = dff,
col = colorsP,
annotation_name_side = "left",
show_annotation_name=TRUE )
MSA_heat_2 <- Heatmap(
matrix = Sim_MSA_mDAG[meta_animals$mDAG_Id,
meta_animals$mDAG_Id],
name = "MSA similarity",
column_title = "m-DAGs MSA-similarity Animals by Phyla",
col = rev(viridis(256)),
cluster_rows = FALSE,
show_heatmap_legend = FALSE,
cluster_columns = FALSE,
top_annotation = annot,
show_column_names = FALSE,
show_row_names = FALSE,
left_annotation =
rowAnnotation(
df = dff,
col = colorsP,
show_annotation_name = FALSE
)
)
Mun_heat_2 <- Heatmap(
matrix = Sim_Mun_mDAG[meta_animals$mDAG_Id,
meta_animals$mDAG_Id],
column_title = "m-DAGs Munkres-similarity Animals by Phyla",
col = rev(viridis(256)),
cluster_rows = FALSE,
show_heatmap_legend = FALSE,
cluster_columns = FALSE,
top_annotation = annot,
show_column_names = FALSE,
show_row_names = FALSE,
left_annotation =
rowAnnotation(
df = dff,
col = colorsP,
show_annotation_name = FALSE
)
)Save graphics
png
  2
png
2 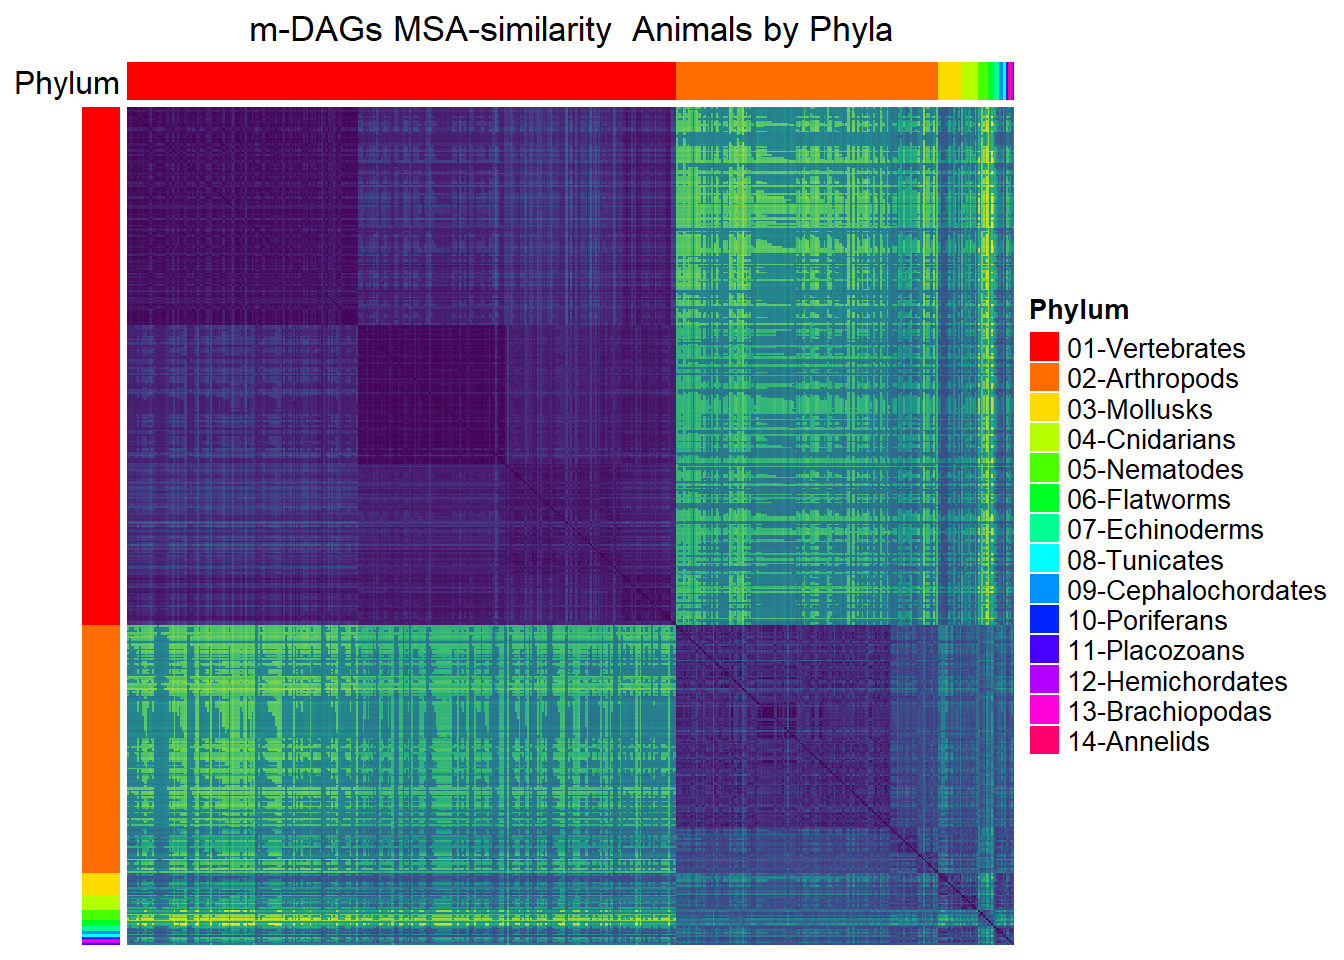
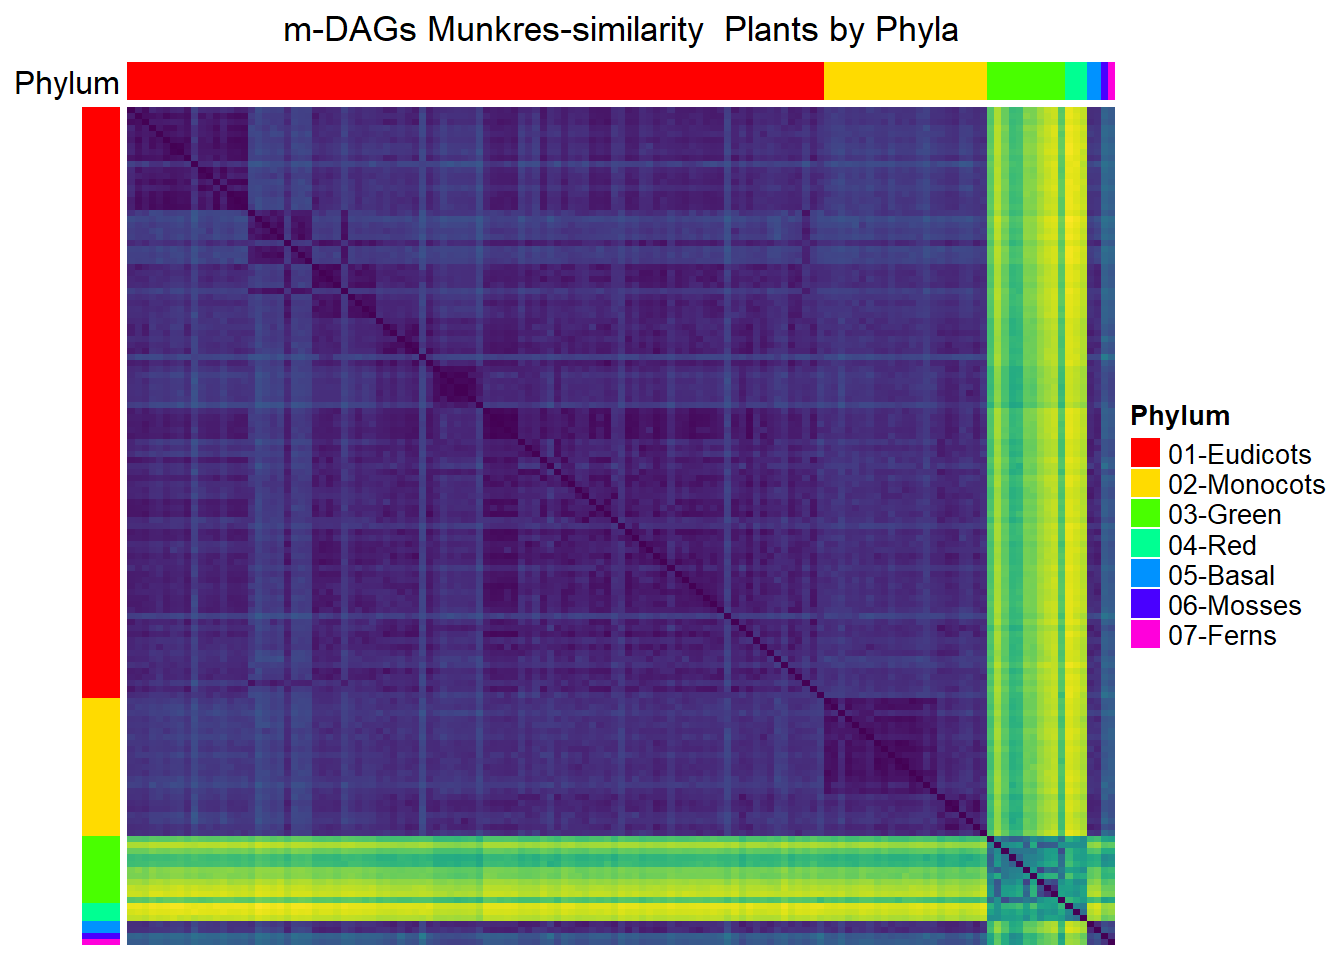
Plants
meta_plants= meta_taxo[1:884,] %>% filter(Kingdom=="Plants")
namesP=names(rev(sort(table(meta_plants$Phylum))))
namesP[1] "Eudicots" "Monocots" "Green" "Red" "Basal" "Mosses" "Ferns" dff=data.frame(Phylum=meta_plants$Phylum)
Phylum=ordered(meta_plants$Phylum,levels=namesP)
numbersP=paste(c(paste0(0,1:7)),namesP,sep="-")
levels(Phylum)=numbersP
dff$Phylum=Phylum
col=rainbow(length(namesP))
colorsP=list(Phylum=col)
names(colorsP$Phylum)=numbersP
annot <- HeatmapAnnotation(df = dff,
col = colorsP,
annotation_name_side = "left",
show_annotation_name=TRUE )
MSA_heat_2 <- Heatmap(
matrix = Sim_MSA_mDAG[meta_plants$mDAG_Id,
meta_plants$mDAG_Id],
name = "MSA similarity",
column_title = "m-DAGs MSA-similarity Plants by Phyla",
col = rev(viridis(256)),
cluster_rows = FALSE,
show_heatmap_legend = FALSE,
cluster_columns = FALSE,
top_annotation = annot,
show_column_names = FALSE,
show_row_names = FALSE,
left_annotation =
rowAnnotation(
df = dff,
col = colorsP,
show_annotation_name = FALSE
)
)
Mun_heat_2 <- Heatmap(
matrix = Sim_Mun_mDAG[meta_plants$mDAG_Id,
meta_plants$mDAG_Id],
name = "Mun similarity",
column_title = "m-DAGs Munkres-similarity Plants by Phyla",
col = rev(viridis(256)),
cluster_rows = FALSE,
show_heatmap_legend = FALSE,
cluster_columns = FALSE,
top_annotation = annot,
show_column_names = FALSE,
show_row_names = FALSE,
left_annotation =
rowAnnotation(
df = dff,
col = colorsP,
show_annotation_name = FALSE
)
)Save graphics
png
2 png
2 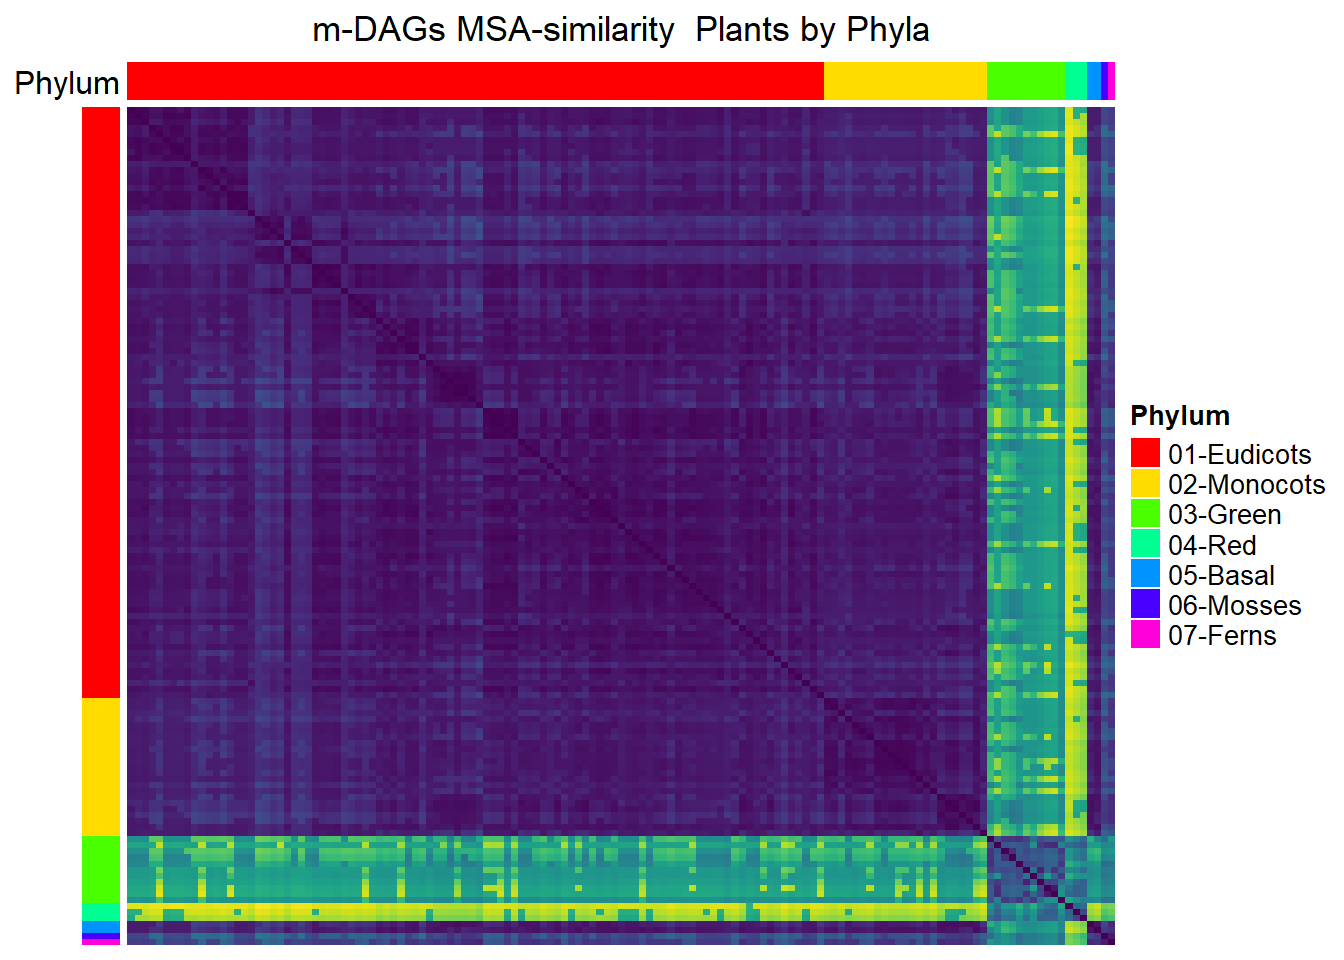
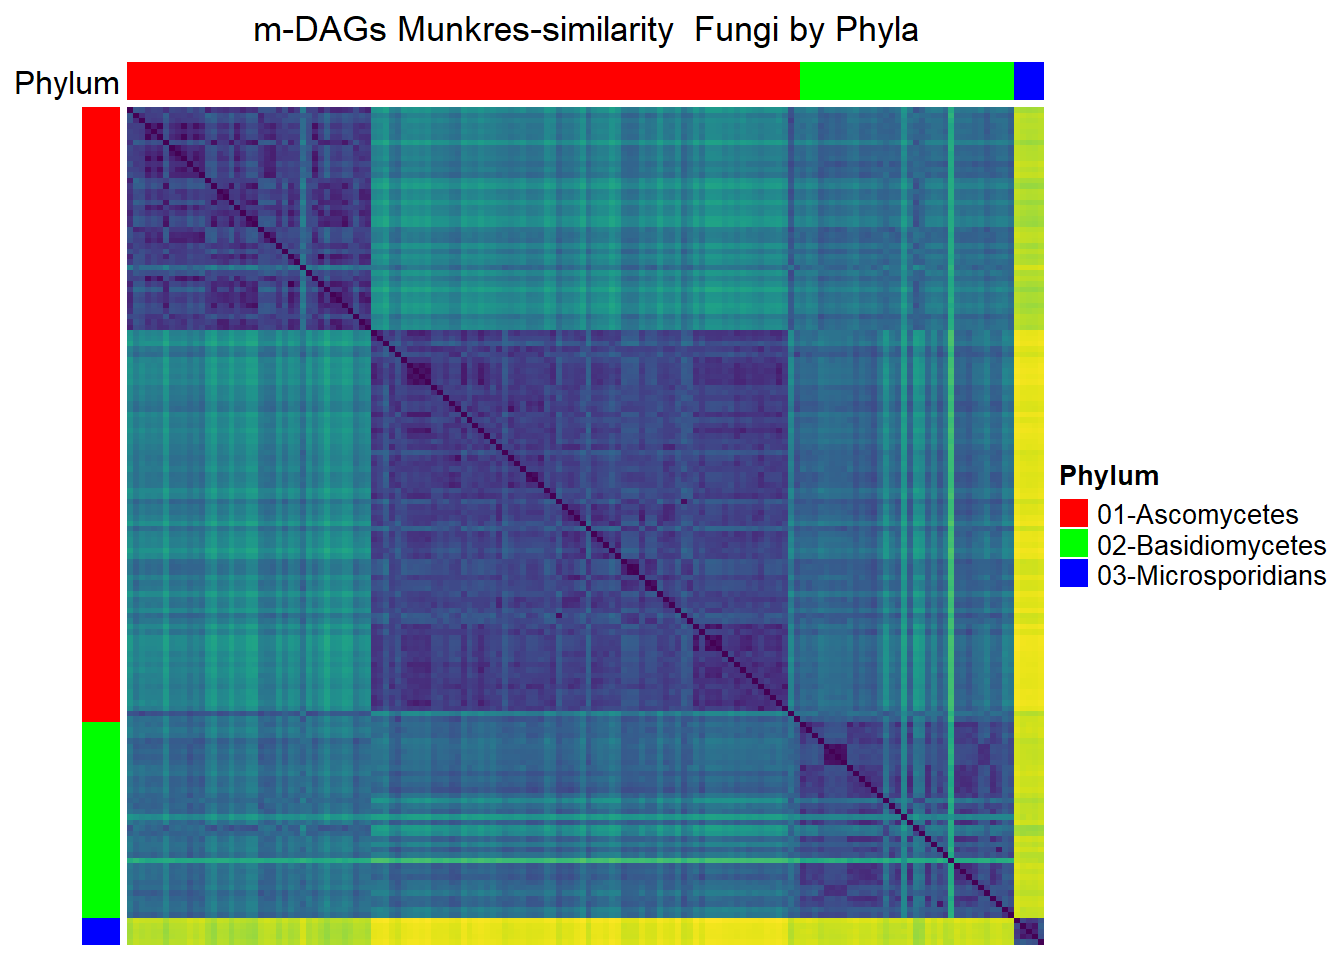
Fungi
meta_fungi= meta_taxo%>% filter(Kingdom=="Fungi")
namesP=names(rev(sort(table(meta_fungi$Phylum))))
namesP[1] "Ascomycetes" "Basidiomycetes" "Microsporidians"dff=data.frame(Phylum=meta_fungi$Phylum)
Phylum=ordered(meta_fungi$Phylum,levels=namesP)
n=length(namesP)
numbersP=paste(c(paste0(0,1:n)),namesP,sep="-")
levels(Phylum)=numbersP
dff$Phylum=Phylum
col=rainbow(length(namesP))
colorsP=list(Phylum=col)
names(colorsP$Phylum)=numbersP
annot <- HeatmapAnnotation(df = dff,
col = colorsP,
annotation_name_side = "left",
show_annotation_name=TRUE )
MSA_heat_2 <- Heatmap(
matrix = Sim_MSA_mDAG[meta_fungi$mDAG_Id,
meta_fungi$mDAG_Id],
name = "MSA similarity",
column_title = "m-DAGs MSA-similarity Fungi by Phyla",
col = rev(viridis(256)),
cluster_rows = FALSE,
show_heatmap_legend = FALSE,
cluster_columns = FALSE,
top_annotation = annot,
show_column_names = FALSE,
show_row_names = FALSE,
left_annotation =
rowAnnotation(
df = dff,
col = colorsP,
show_annotation_name = FALSE
)
)
Mun_heat_2 <- Heatmap(
matrix = Sim_Mun_mDAG[meta_fungi$mDAG_Id,
meta_fungi$mDAG_Id],
name = "Mun similarity",
column_title = "m-DAGs Munkres-similarity Fungi by Phyla",
col = rev(viridis(256)),
cluster_rows = FALSE,
show_heatmap_legend = FALSE,
cluster_columns = FALSE,
top_annotation = annot,
show_column_names = FALSE,
show_row_names = FALSE,
left_annotation =
rowAnnotation(
df = dff,
col = colorsP,
show_annotation_name = FALSE
)
)Save graphics
png
  2
png
2 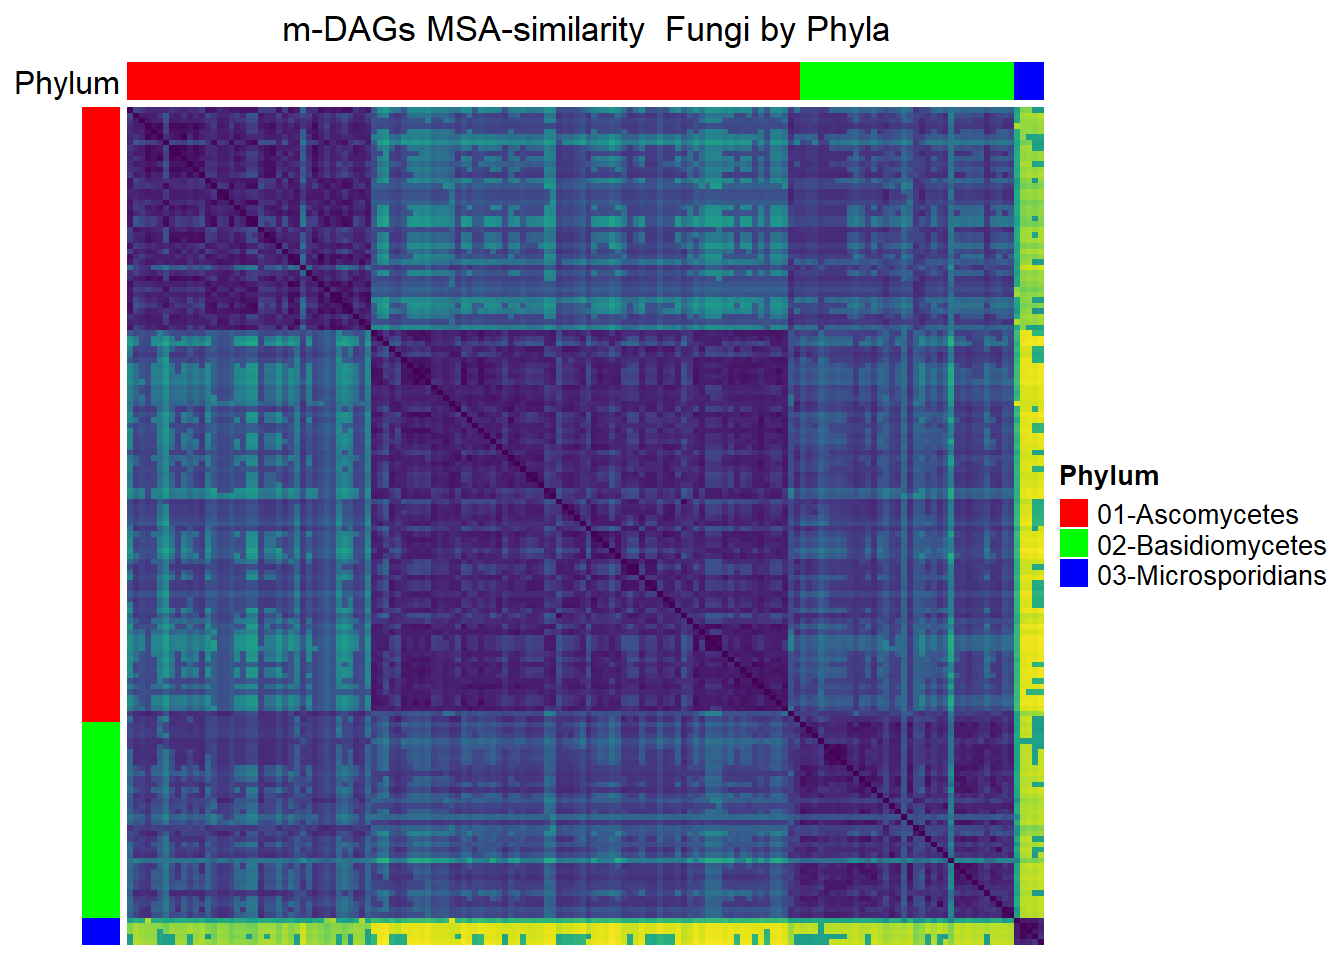
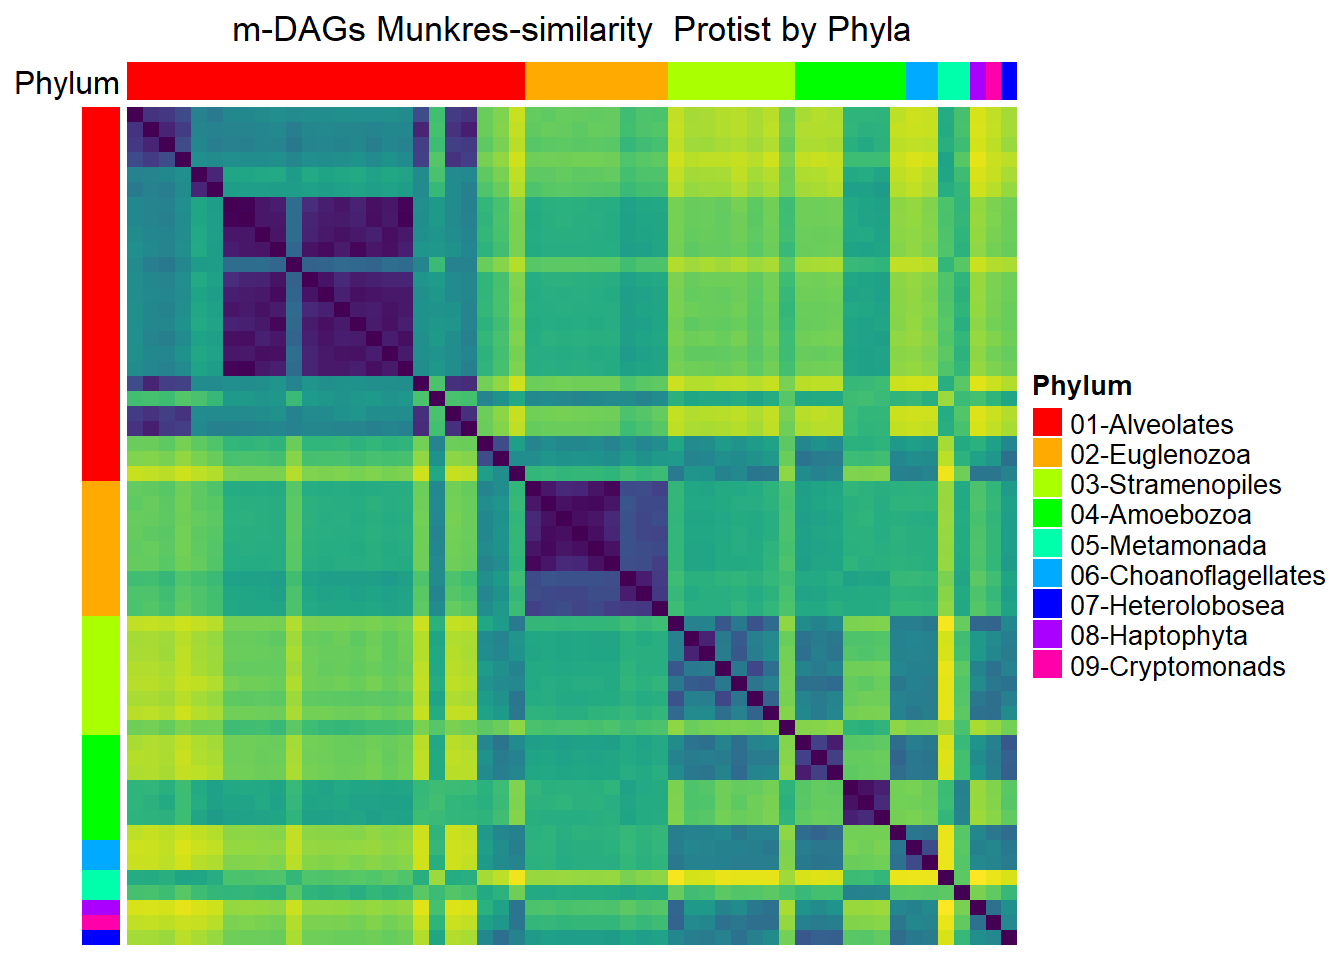
Protists
meta_protists= meta_taxo %>% filter(Kingdom=="Protists")

namesP=names(rev(sort(table(meta_protists$Phylum))))
namesP
[1] "Alveolates" "Euglenozoa" "Stramenopiles"
[4] "Amoebozoa" "Metamonada" "Choanoflagellates"
[7] "Heterolobosea" "Haptophyta" "Cryptomonads" dff=data.frame(Phylum=meta_protists$Phylum)
Phylum=ordered(meta_protists$Phylum,levels=namesP)
n=length(namesP)
numbersP=paste(c(paste0(0,1:n)),namesP,sep="-")
levels(Phylum)=numbersP
dff$Phylum=Phylum
col=rainbow(length(namesP))
colorsP=list(Phylum=col)
names(colorsP$Phylum)=numbersP
annot <- HeatmapAnnotation(df = dff,
col = colorsP,
annotation_name_side = "left",
show_annotation_name=TRUE )
MSA_heat_2 <- Heatmap(
matrix = Sim_MSA_mDAG[meta_protists$mDAG_Id,
meta_protists$mDAG_Id],
name = "MSA similarity",
column_title = "m-DAGs MSA-similarity Protist by Phyla",
col = rev(viridis(256)),
cluster_rows = FALSE,
show_heatmap_legend = FALSE,
cluster_columns = FALSE,
top_annotation = annot,
show_column_names = FALSE,
show_row_names = FALSE,
left_annotation =
rowAnnotation(
df = dff,
col = colorsP,
show_annotation_name = FALSE
)
)
Mun_heat_2 <- Heatmap(
matrix = Sim_Mun_mDAG[meta_protists$mDAG_Id,
meta_protists$mDAG_Id],
name = "Mun similarity",
column_title = "m-DAGs Munkres-similarity Protist by Phyla",
col = rev(viridis(256)),
cluster_rows = FALSE,
show_heatmap_legend = FALSE,
cluster_columns = FALSE,
top_annotation = annot,
show_column_names = FALSE,
show_row_names = FALSE,
left_annotation =
rowAnnotation(
df = dff,
col = colorsP,
show_annotation_name = FALSE
)
)Save graphics
draw(MSA_heat_2,merge_legend=TRUE)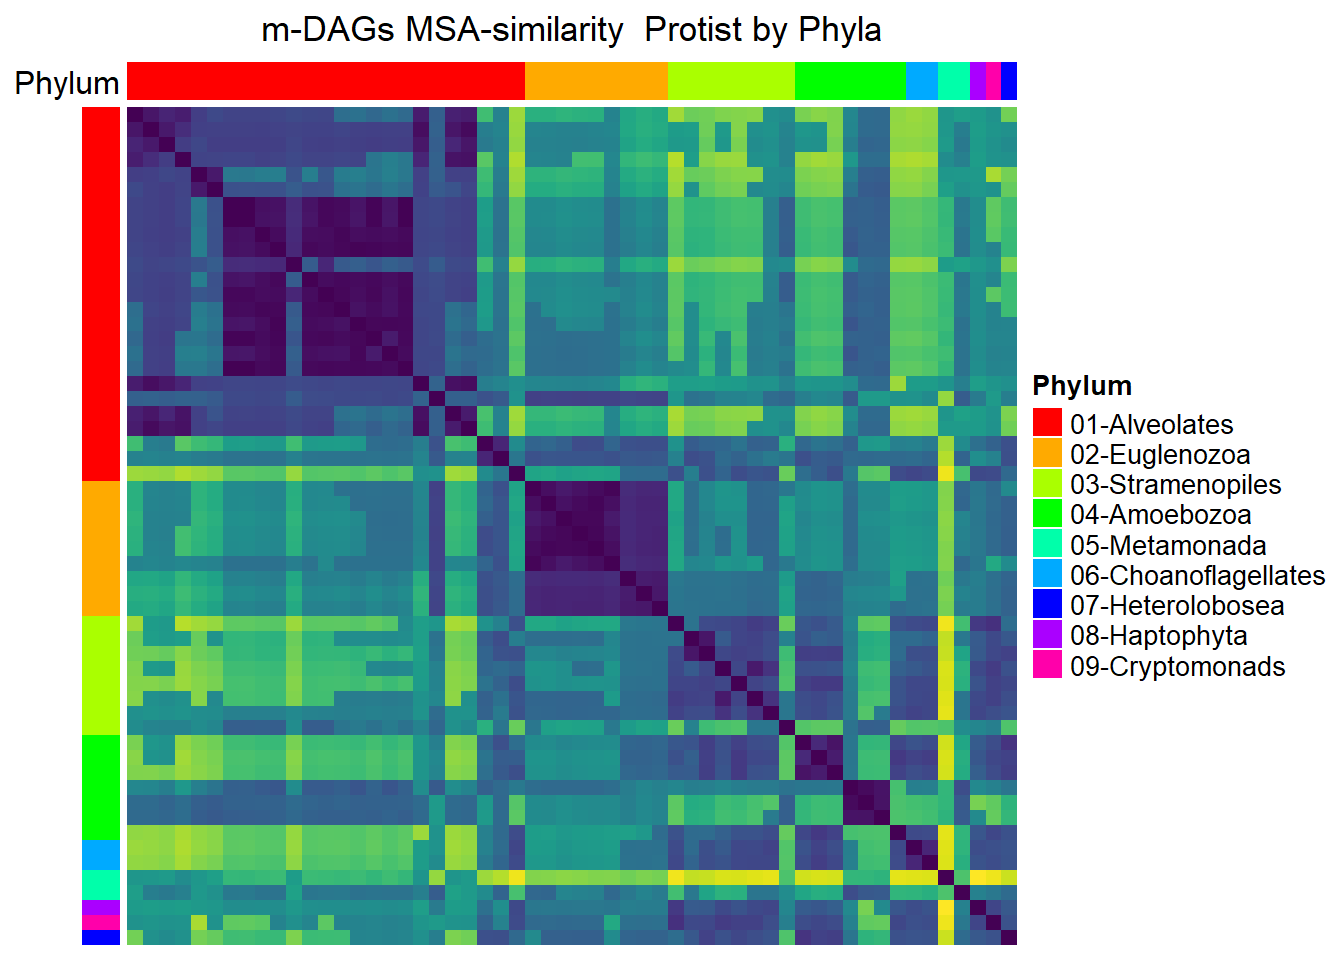
draw(Mun_heat_2,merge_legend=TRUE)